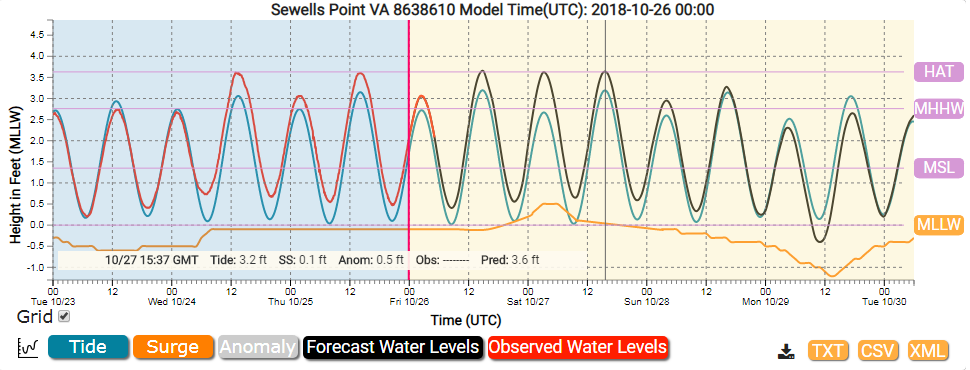
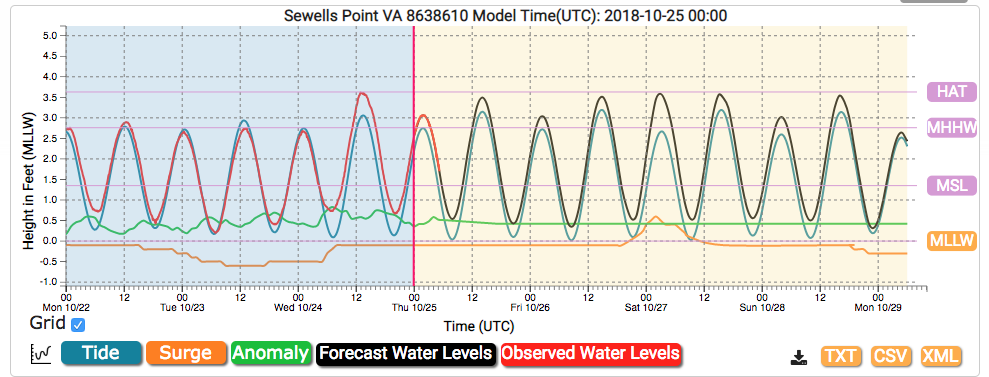
- Final Update - Indeed, Dave. It was predicted in Tidewatch and ETSS in Yesterday's morning update (image from yesterday's 10/26 update) that the water level at Sewell's Point last night would be 1 ft. above the astronomical high tide duye to the Nor'easter:

Instead, it was closer to 1.5 ft., as shown this morning (0.4-0.5 ft. under-prediction for Friday evening), and now showing 4 ft above MLLW for the king today instead of Yesterday's 3.6 ft: https://slosh.nws.noaa.gov/etsurge2.0/index.php?stid=8638610&datum=MLLW&show=1-1-0-1-1
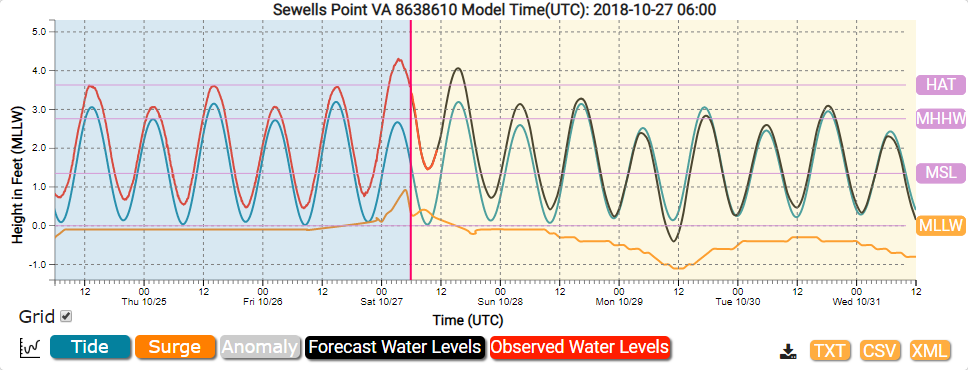
Tidewatch is showing a slightly higher forecast at Sewells Point than ETSS at 4.25 ft. for the king this morning, which is slightly lower than last night's observed water level, with similar results at Yorktown. Each of these water level sensor forecasts (ETSS above and tidewatch below) update hourly to incorporate the latest observations (and adjust accordingly using a predictor-corrector equation):
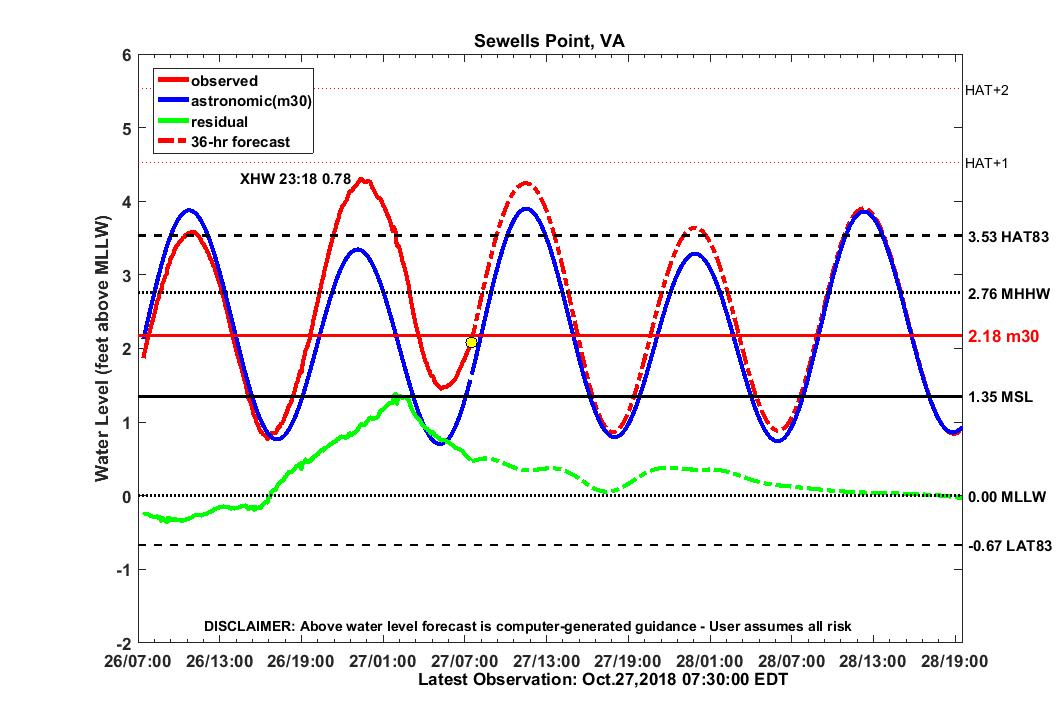
For Sensor-Model Forecast Comparisons (courtesy of NWS Wakefield):
https://www.weather.gov/akq/SewellsPoint
https://www.weather.gov/akq/Yorktown
https://www.weather.gov/akq/CBBT
People can look for their data to appear on the map on this page after 4:00pm after the last CtK SLR App KT Region events have closed (best viewed on a computer): http://www.vims.edu/people/loftis_jd/Catch%20the%20King/20181027-king-tide/index.php
You can check out the map now to view the model's maximum predicted inundation extents for today's king tide and for Tidewatch forecasts at sensors near you.
Thank you for volunteering and stay safe!
- Short take - On account of the approaching Nor'easter, Saturday morning's king tide looks to be running 2/3 of a foot higher than astronomically anticipated. It now looks as though the weather will be overcast and not significantly raining during the peak mapping on Sat. from 10-2 pm.
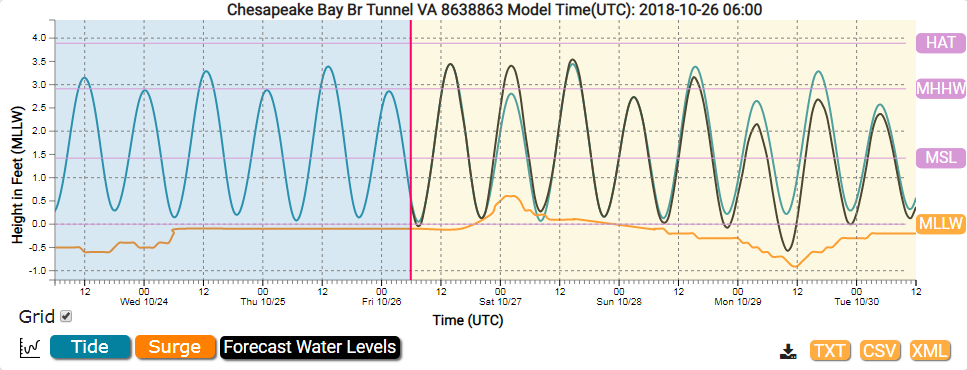
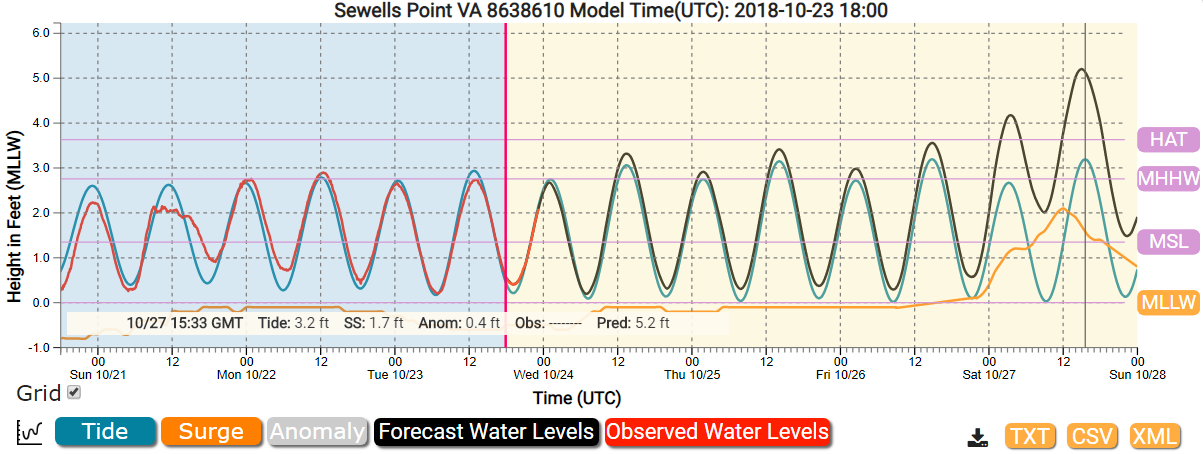
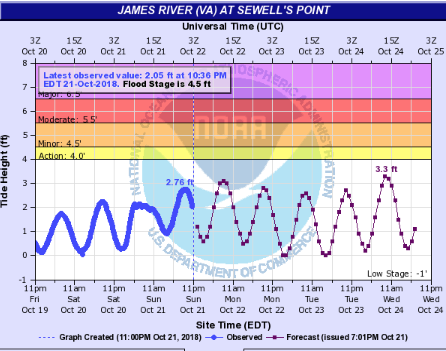
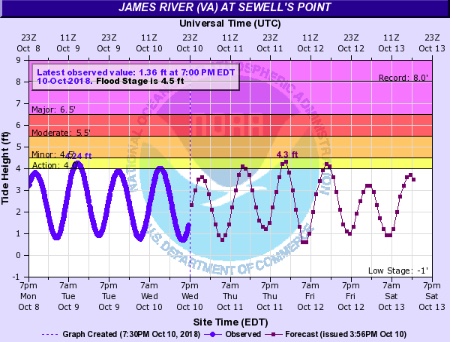
As illustrated by the 3 forecast plots below, this evening's high tide (close to 11pm local time) will be amplified by nearly 1 ft. by the nor'easter, but because it lands during the lower of the two high tides, it will likely be similar in height to Saturday's king tide (but will vary slightly throughout the region). The teal line's astronomical tidal signal peaks with the king tide on Sat. (which is why it's the king), yet the ~0.5 ft. orange line's surge prediction accompanying the rapidly moving weekend nor'easter has settled in 12 hours earlier and slightly weaker here than we initially noted on Tuesday's update, when it was forecasted to amplify Sat. Morning's king tide:
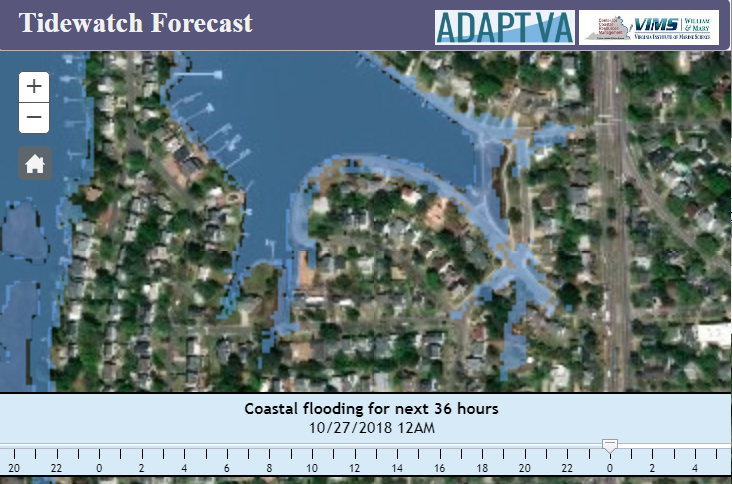
At Sewells Point, this morning's high tide is projected to be about the same as tomorrow's, with tomorrow's king being about an inch (or so) higher (barely noticeable on the graph; Tidewatch Flood Map in Norfolk Larchmont Neighborhood):
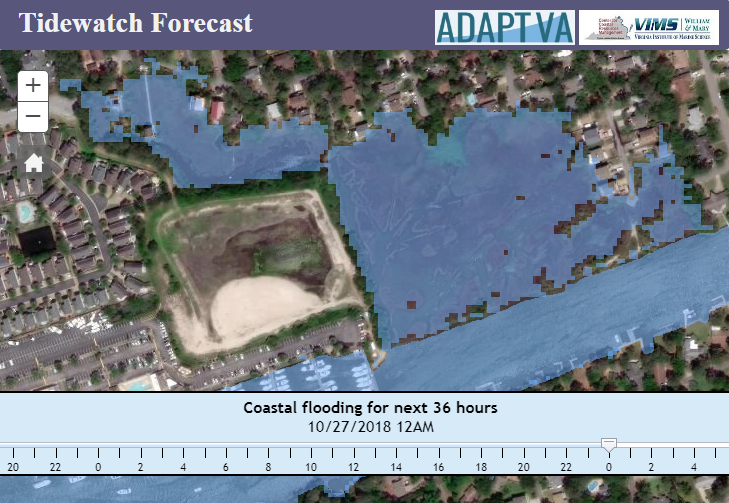
At the Chesapeake Bay Bridge Tunnel, the King will be higher than tonight's wind (lower high) tide (Tidewatch Flood Map in Virginia Beach near Bay Island / Lynnhaven Inlet):
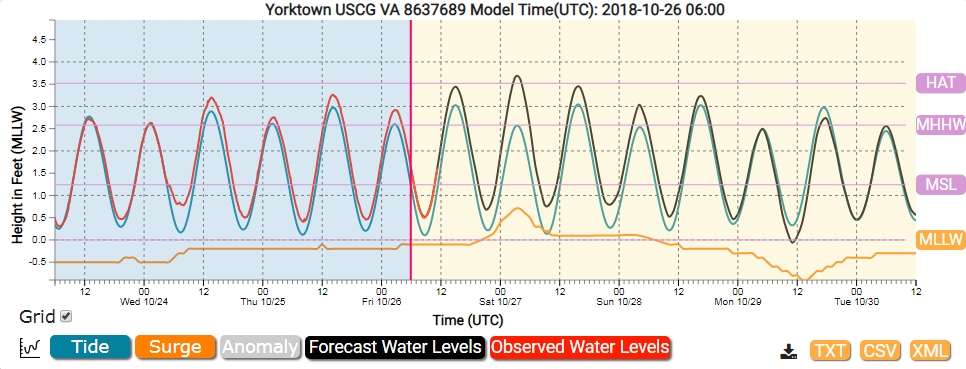
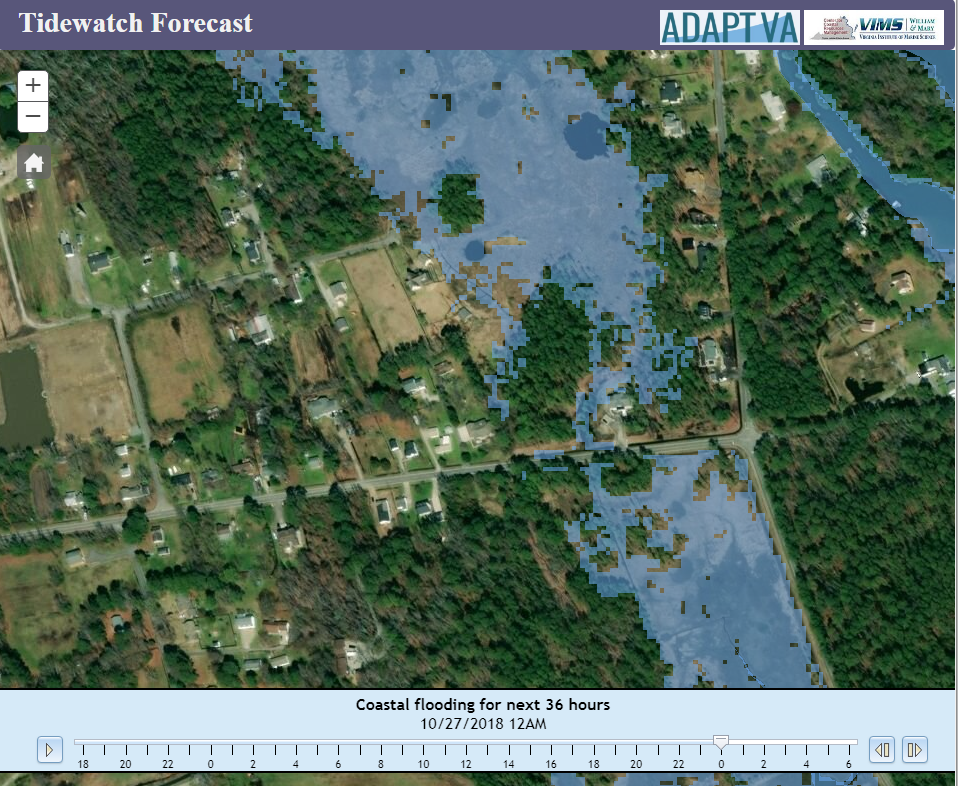
At Yorktown, Friday evening's lower high tide will be amplified by more than one foot (higher than other areas of the region) to be perceptibly larger than Saturday's King Tide as the Nor'easter strengthens moving northward (Tidewatch Flood Map along Seaford and York Point Rd.'s in York Co.):
- Friday Morning Update - We have entered into the 36-hr Tidewatch forecasting window for the King Tide last night. As we have seen with the impending nor'easter event coming to Hampton Roads on early Saturday morning, atmospheric forecasts can vary significantly (as do water level forecasts drawn from these predictions) as the weather models they are informed by converge on an increasingly accurate solution. Thus, the Virginia Institute of Marine Science's (VIMS) flood forecasts from their Tidewatch, SCHISM, and street-level models wait until uncertainty in weather conditions are mostly resolved to arrive at a reasonably reliable inundation forecast. You can view Tidewatch forecasts through AdaptVA's Forecasts Portal: http://cmap2.vims.edu/SCHISM/VACoastalFloodingPredictor_DT.html
- What the Model Does - As you might imagine, it requires substantial computing power to predict hourly flooding extents at 5-m (~16.4 ft.) resolution throughout Hampton Roads. So their models are automated to initiate simulations within a moving window of 36-hrs, when atmospheric models have mostly made up their mind, updating at ~9 am and 9 pm daily. The operational version of the Tidewatch Viewer is driven by VIMS' SCHISM hydrodynamic model developed by Dr. Joseph Zhang at the VA Center for Coastal Resources Management (CCRM). For more information on the Tidewatch model's inputs and outputs, see * below.
- Where it Does it - The current version of the model's automated mapping outputs are limited to a subset of Hampton Roads covering most of the south side including Virginia Beach, Norfolk, Portsmouth, Chesapeake, and parts of Suffolk along the James, and significant areas of the peninsula in Hampton, Newport News, Poquoson, and parts of York County. The CCRM released the current automated coastal mapping product a few weeks prior to Hurricane Florence's arrival, and they aim to have all of Coastal VA in the Tidewatch Map Viewer by the end of 2018.
As this does not cover all of the areas our adept Catch the King volunteers aim to map with the Sea Level Rise App in VA on Saturday, a static map of tidal maximum flooding extents is available here for all of Coastal VA (and will be where all volunteer's GPS points will appear on Sat. afternoon): http://www.vims.edu/people/loftis_jd/Catch%20the%20King/20181027-king-tide/index.php
- *How it Does it - The Tidewatch viewer initiates hydrodynamic modeling simulations using VIMS' open source SCHISM model by downloading wind speeds, directions, and air pressure outputs from the nested North American Mesoscale model (NAM) at 5km resolution and 1-hr resolution. While downloading the atmospheric inputs, the model downloads the latest streamflow measurements from the US Geological Survey's (USGS) stream gauges at the fall lines of major tributaries incorporated in SCHISM, to incorporate upstream river discharge. Finally, the model estimates harmonic tidal components for tidal phases, amplitudes and frequencies for tides at the open boundary of the model, which closely follows 60 deg W Longitude over the Atlantic Ocean. Once all inputs are downloaded and converted to the model's input format, the inundation forecast simulation is initiated. This typically requires 1.5 hours to complete using 2D-depth averaged estimations of water levels throughout the entire model domain each hour. These binary model outputs are then geographically converted and interpolated to a series of geo-referenced high-resolution .tif images and then organized by hourly outputs and shared through ArcGIS Servers through AdaptVA's Forecasts Portal. Please note that as a large scale hydrodynamic model, SCHISM's results rendered in the Tidewatch Forecast Map do not currently incorporate stormwater drainage systems, rainfall, or groundwater infiltration, and is strictly an inundation map of the storm tide.
- Short take - The forecasts for the northeaster this Friday and Saturday have now weakened the storm a bit. This will cause water levels to be approaching 1.5 feet above predicted astronomical tides.
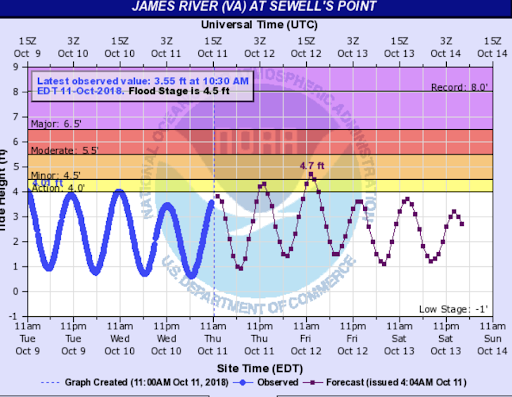
- Water Level Outlook - The forecast northeaster will produce some flooding for you to measure on Saturday. This graph shows the astronomical tide (blue) and the predicted tide including the storm surge from the northeaster (black). The water level Saturday afternoon is predicted to be about the same as Friday midday and early Saturday morning so you can determine the areas to measure Friday noon if you wish.
With winds from the north water levels in the Back Bay and North Landing areas will be normal or below normal.
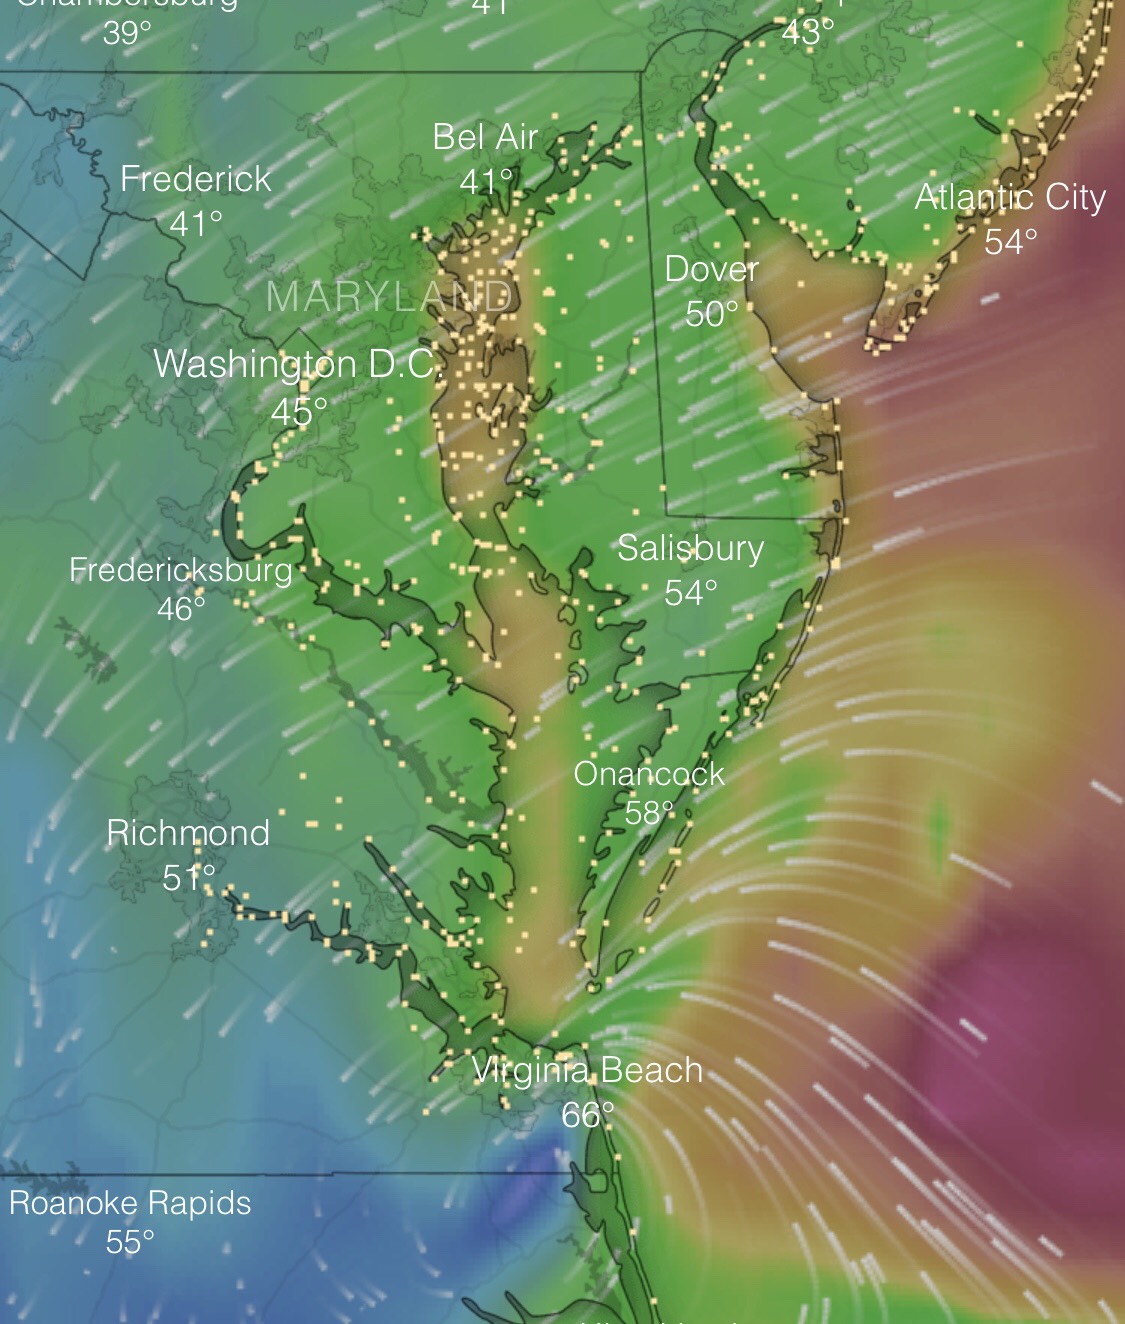
- Storm Forecast (updated at 10:26am) - A nor'easter will move up the coast late Friday and Saturday resulting in a period of significant winds, tidal surge and rain. Winds will increase late Friday likely peaking some time Saturday morning. While it is still early, it appears East and Northeast winds could gust tp 30 to 35 mph Saturday morning. The wind will work to push tides well above normal resulting in possible moderate flooding causing 0.5 to 1.5 feet of inundation in some areas during the high tide Saturday. In addition, 1 to 2 inches of rain is possible Friday afternoon into early Saturday. Please keep up with the latest forecasts as the weekend approaches.
- Short take - The forecast of a northeaster this Friday and Saturday will cause water levels to be at least one foot and possibly more above predicted astronomical tides.
- Water Level Outlook - The forecast northeaster will produce minor flooding for you to measure on Saturday. This graph shows the astronomical tide (blue) and the predicted tide including the storm surge from the northeaster (black).
- Update on the server that gets your data on Saturday - At 7:45 am on Tuesday, the Sea Level Rise App’s servers and the Sea Rising Solutions site were updated to effectively double the available CPUs and RAM in preparation for Catch the King on Sat. With over 120 schools on board, the number of app registrations has dramatically increased in the last several weeks. The folks at Concursive are working to keep the app online through the flood of data for the entirety of the king tide with no crashes.
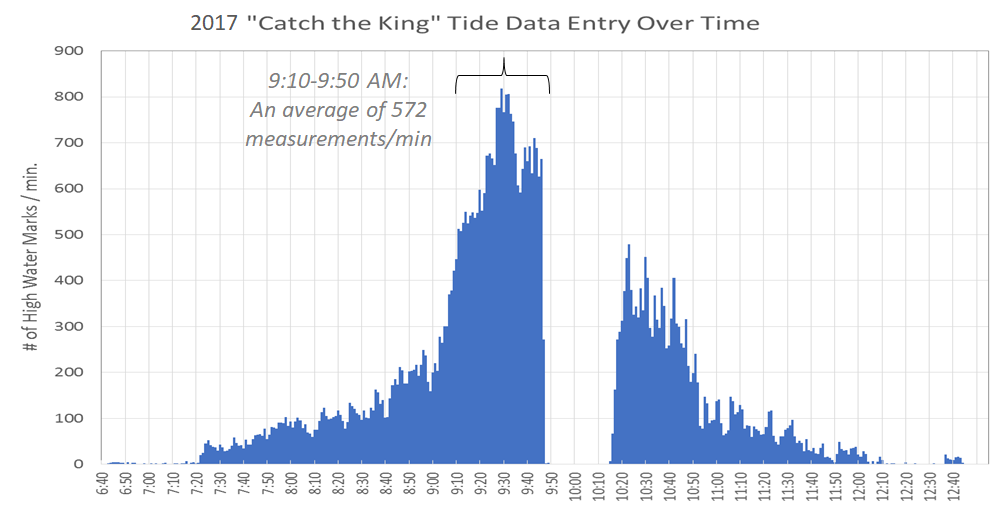
- Fun Fact: During last year's Catch the King, in the 40 mins. leading to the 18-min. crash of the App, there was an average of 572 incoming data points per minute, peaking at 827 in one minute from 09:28:00 to 09:28:59! While pictures are useful to help support flood extents, GPS data points tracing the high tide are more useful for scientists to extract flood contours to compare with and improve their models.
- Forecasts show a low off our coast Saturday morning with strong winds from the northeast easing in the late morning. We can expect clouds and intermittent rain throughout Friday afternoon and Saturday.
- Learn about the use of last year's Catch the King volunteers' data: VIMS will once again help “Catch the King”
- At around 1:40pm today see a live stream of Dr. Derek Loftis giving a presentation on Catch the King with new data from Hurricane Florence and some insights from Michael in Hampton Roads to the “Help Catch the King Tide” public Facebook group. Public groups do not require a login to view content: Facebook group page
- Short take - The NOAA Weather Service is forecasting a low moving off the coast in the Friday to Saturday time frame. This system may cause some extra coastal flooding. More later as the forecasts become more accurate.
- Tide Outlook - The tide prediction (astronomical plus wind and ocean effects) suggests tides will be as or near astronomically predicted. This will change as the forecast for a possible low forming on Friday is included in the forecast.
In the southern watersheds (Back Bay, etc.) water levels have dropped. The approach of a low later in the week may cause water level increases.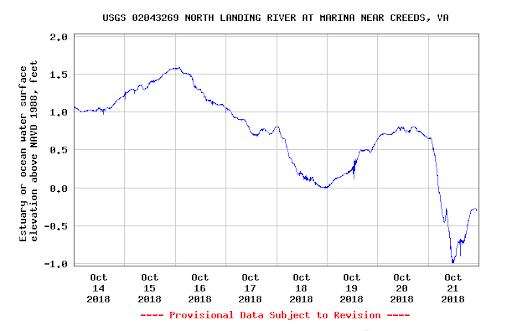
- Short take - Michael will cause minor flooding in the Chesapeake Bay influenced shores while southerly winds will cause persistent flooding in the the Pungo, North Landing River, and other waterways exposed to the Carolina sounds. Rainfall of 2 to 4 inches on Thursday evening and Friday morning may cause flooding especially during the high tides.
- Tide Outlook - Tides on the lower Chesapeake Bay will cause minor flooding around noon on Friday as the remains of Michael pass over the region.
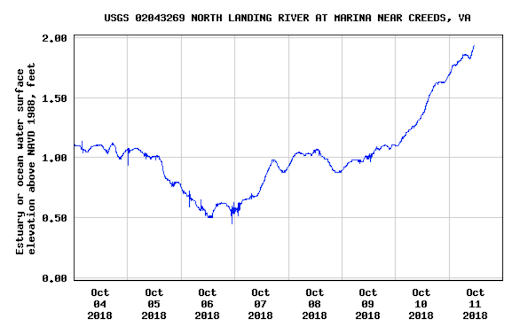
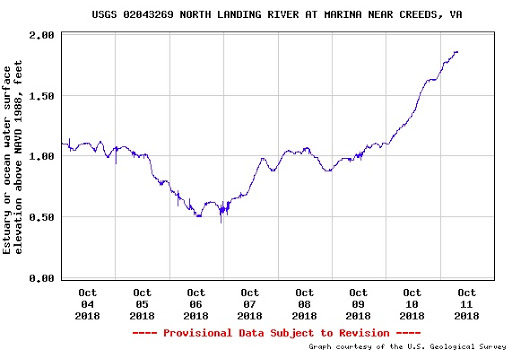
Tides in the tidal creeks draining in to North Carolina will see wind flooding because of the strong southerly winds associated with Michael. This chart shows the water level at North Landing near Creeds. If this trend continues expect 2 to 3 feet on Friday.
- Flooding - Predictions are that the fast moving Michael will not cause significant flooding on Friday. However, the persistent winds from the south are causing flooding in the Back Bay and North Landing River areas that are exposed to the Carolina sounds.
- Rain - Heavy rains of around 4” are expected overnight Thursday into Friday morning.
- Hurricane Michael - The hurricane will be passing Hampton Roads Thursday afternoon and evening. Winds will become strong from the southeast then switch to the northerly.
- Tide Outlook - Tides are running below minor flooding values on Thursday.
- Flooding Outlook -Very minor to no flooding predicted for Thursday. If the hurricane winds switch to coming from the north to northeast we may see more flooding.
- Winds - Winds continue blowing out of the southeast.
- Rain - 2 - 4 inches of rain are expected Thursday and Friday as Hurricane Michael goes over Hampton Roads
- Hurricane Michael - The hurricane will be passing Hampton Roads Thursday afternoon. Winds will become strong from the southeast then switch to the northerly.
- The Gulf Stream and Ocean Dynamics - The predicted tides are one foot above expected from the winds alone because of ocean dynamics. The current slowing of the Gulf Stream may be contributing to the extra foot of water level.
The south wind is causing flooding in the southern parts of our region exposed to the Carolina sounds.
- Tide Outlook - Tides are running about 1 foot above predicted.
- Flooding Outlook - Minor flooding tides will occur throughout the region around noon and midnight Wednesday
- Winds - Winds will be from the southeast and may cause higher water levels in the Back Bay areas.
- Rain - No rainfall is expected Wednesday. The City of Virginia Beach is lowering levels in stormwater storage ponds in preparation for Hurricane Michael on Friday.
- Hurricane Michael - The Hurricane will cause minor flooding tides Friday as it approaches our region.
- The Gulf Stream - The higher water levels we are seeing with no wind are probably due to the slowing of the Gulf Stream. It has been slower for several days now.
Updates provided by
Larry Atkinson
Center for Coastal Physical Oceanography
Old Dominion University